
Farmers make six-figure bets on a hunch. We're giving them the data.
Agristato turns soil analysis and five years of market prices into one question a grower can actually answer: what should I plant, and where do I sell it?
The problem
Agriculture still runs on paper, gut feeling, and a spreadsheet somebody forgot to update.
We started with a real person, not a market deck. An agronomist we worked with carried two problems around every season. First, soil analysis: he ran correction and fertilizer math by hand, in a tangled Excel sheet, for every client. Second, the question that hung over every grower he advised — what is actually worth planting this season, and will the price hold at harvest?
Nobody had a straight answer. The price data existed — every CEASA (Brazil's wholesale produce hubs) publishes it — but it was scattered, historical, and useless at the moment of decision. Growers were committing land, labor, and cash to crops months ahead, with no read on where prices were heading.
The data already existed. The decision didn't have a tool.
Two modules, two kinds of grower
Quotation Radar
For small and mid-size growers of fruit, vegetables, and greens. It pulls weekly price data from the CEASA network and, against five-plus years of history, projects where each crop's price is heading toward harvest.
The grower picks the crops and markets they're considering; the system ranks them — which has the strongest upward trend, which is most competitive across the markets they can reach.
Soil Analysis
For large-scale, precision-agriculture growers. It takes the soil analysis math that lived in our agronomist's spreadsheet — correction cost, maintenance cost, fertilizer recommendation — and automates it.
Same goal as the Radar from the other end of the field: turn a manual, error-prone calculation into a decision a grower can trust.
The product
From “what should I plant” to a ranked answer
The grower sets a scenario — crops, markets, planting date — and the Radar does the rest. Real screens from the beta.
01
The opportunity radar
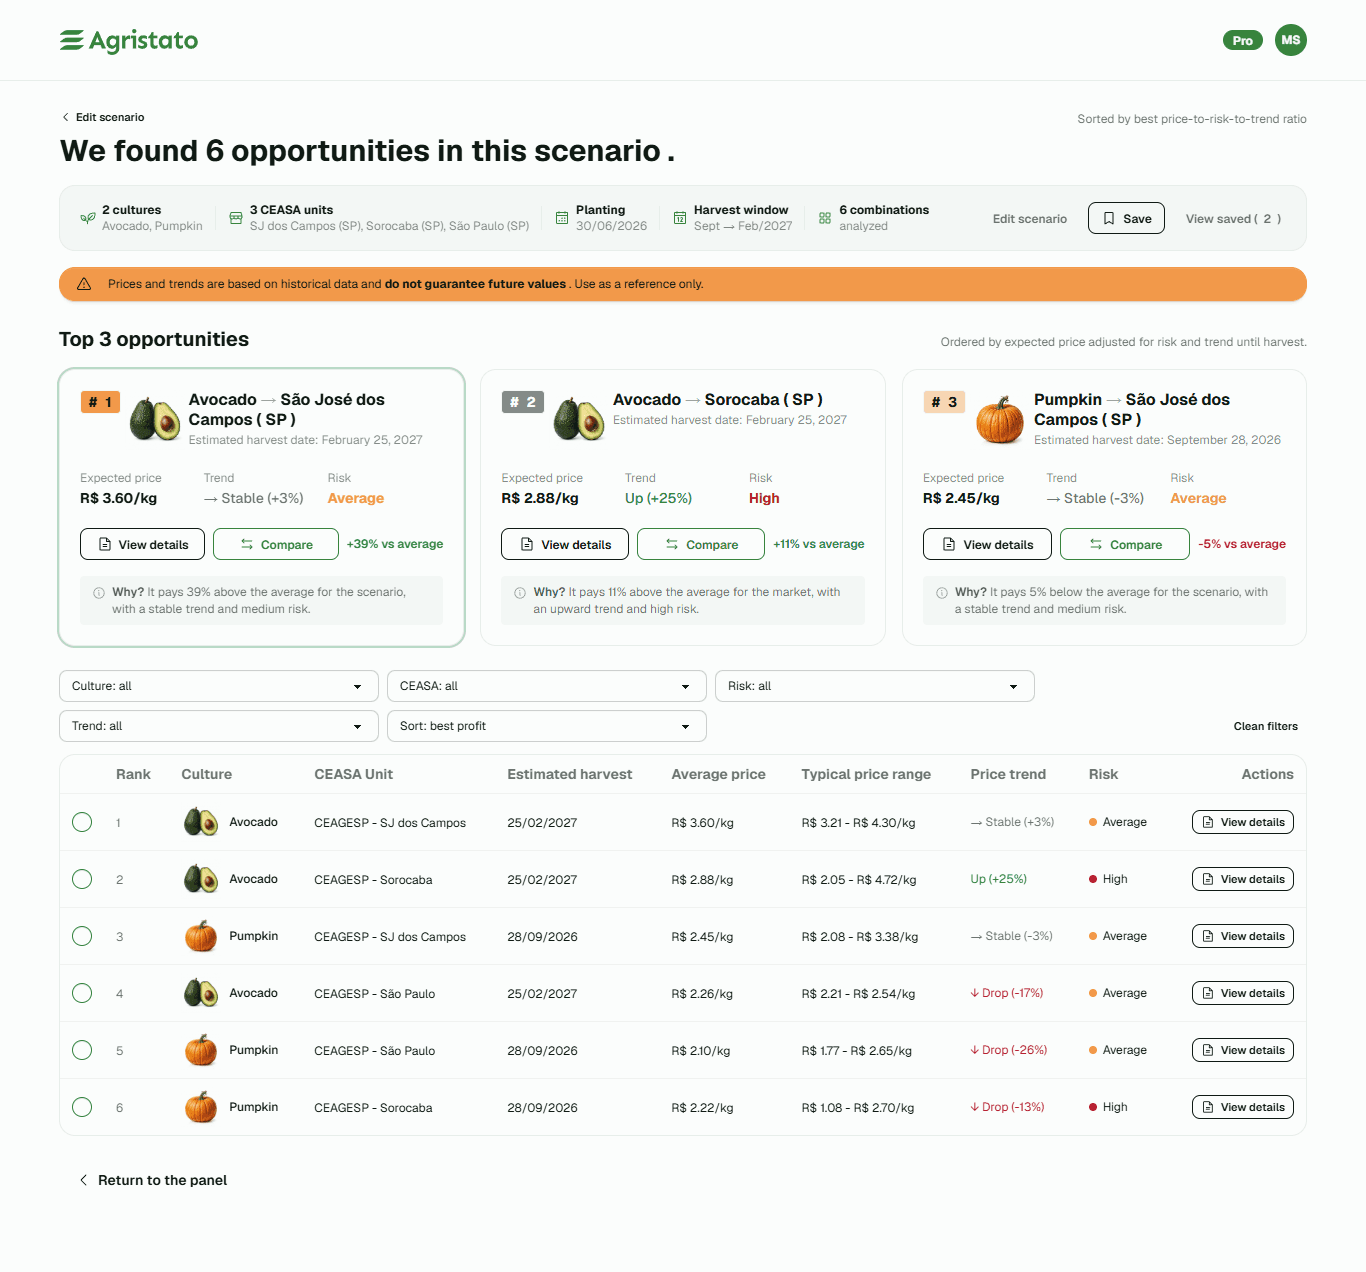
Pick the crops and CEASA markets you're weighing, and the Radar ranks every combination by expected price adjusted for risk and trend until harvest. Each card answers the question out loud — "why is this #1?" — instead of leaving the grower to interpret a number.
02
The detail behind a number
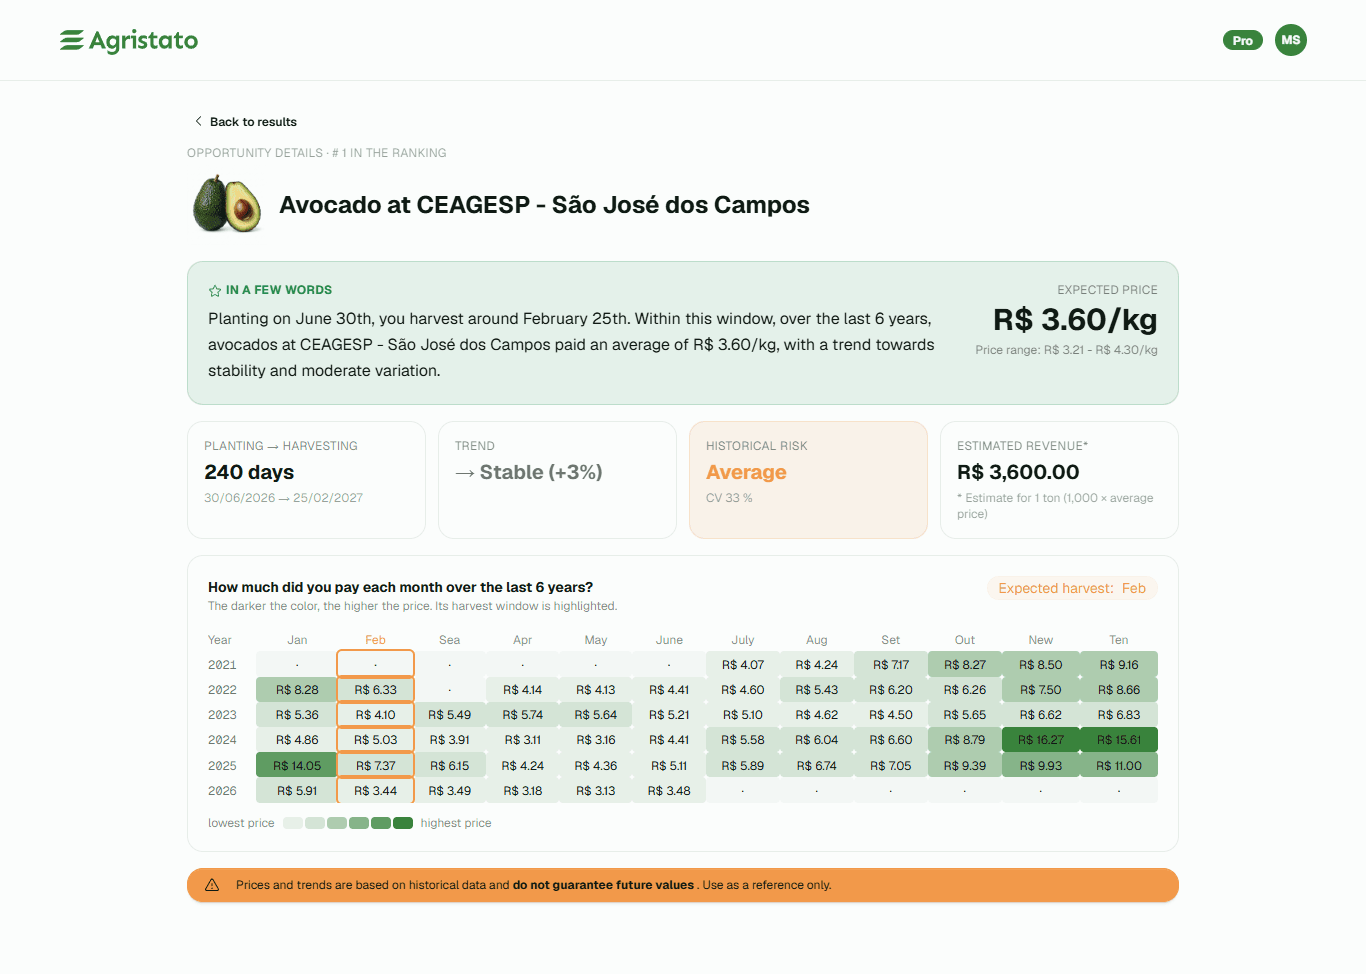
Drill into any opportunity and the projection stops being a black box: planting-to-harvest window, historical risk (coefficient of variation), and a six-year heatmap of what that crop actually paid month by month at that market — harvest window highlighted.
03
Comparing the finalists
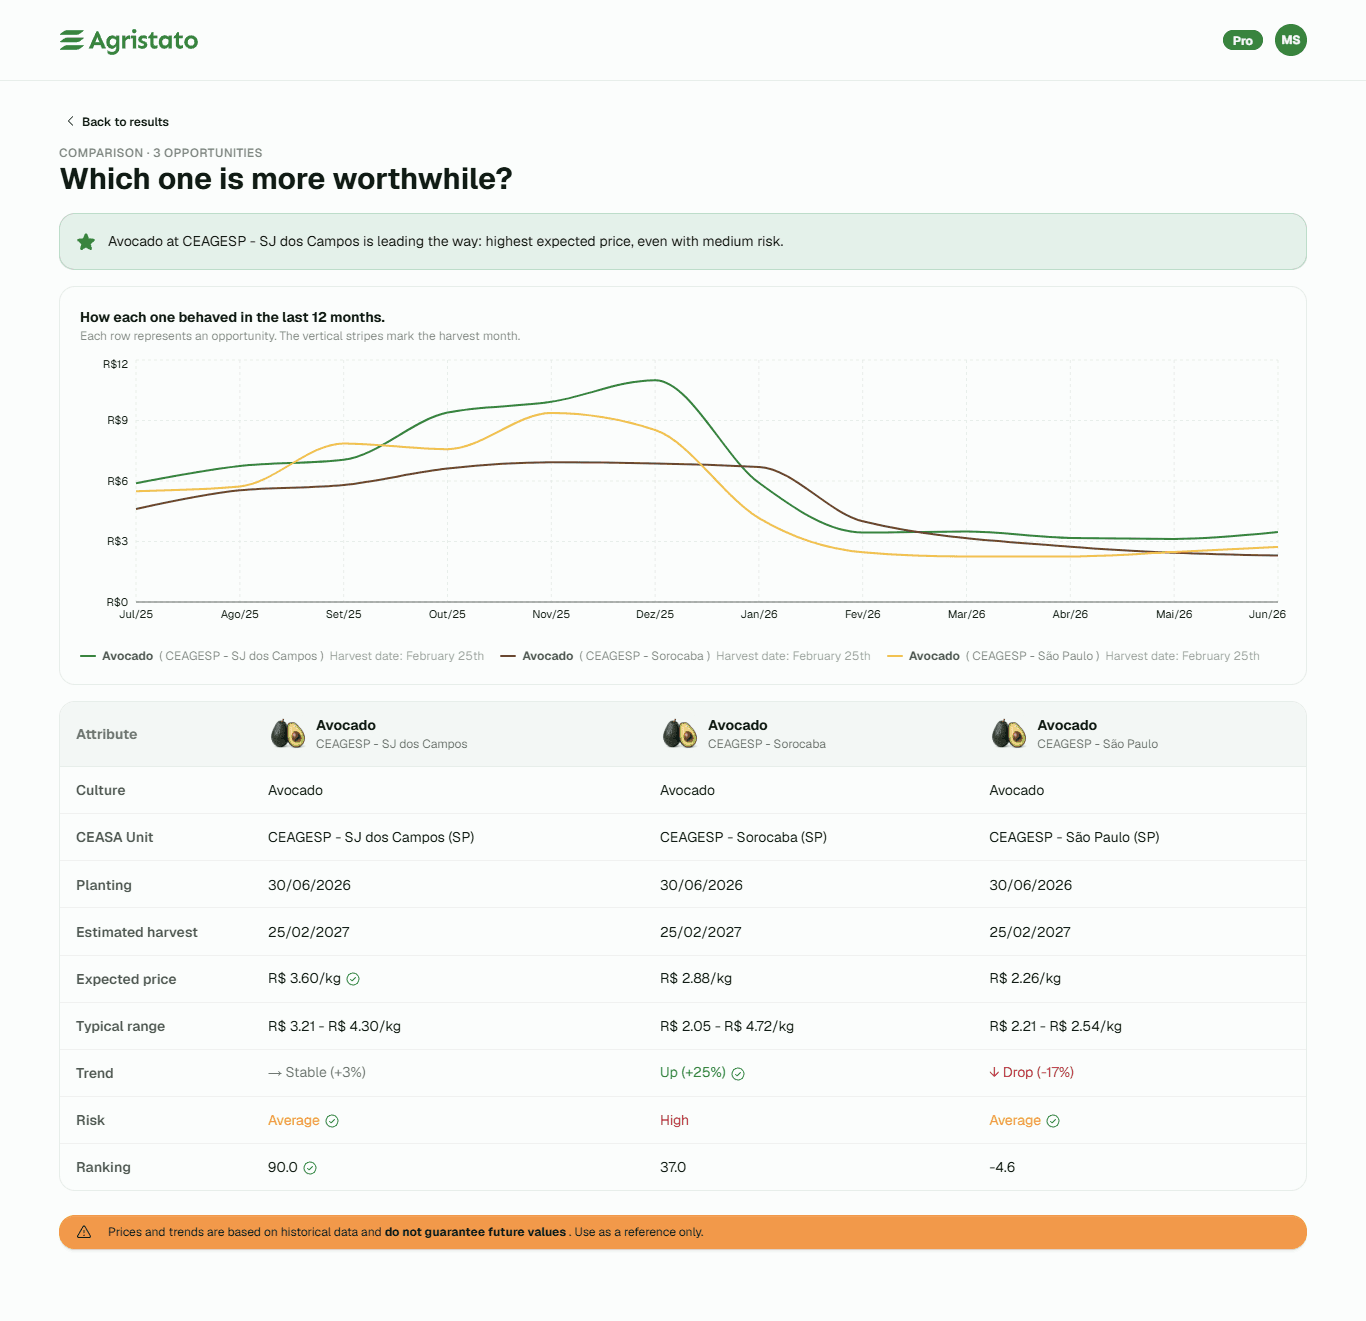
When two or three options look close, the comparison view puts them side by side — 12-month price behavior, typical range, trend, risk, and the final ranking score — so the call is grounded in the data, not a gut feeling.
The design behind it
Where the flow got pressure-tested
The screens above started here. This is the working Figma file — the full flow, the dead ends, and the design tensions we argued over before any of it shipped.
it's the real Figma file. scroll inside it, zoom, poke around.
What building this taught me
The hard part wasn't the idea. It was killing the other ideas.
When the scope is wide open, the ideas are endless — and that feels like progress until you notice you're shipping nothing. We changed the product and business model more times than I want to admit. We were stuck in a loop: iterate, reconsider, iterate again, never put it in front of a grower.
The most useful skill turned out to be saying no — prioritizing ruthlessly when everything looks worth building.
So we changed strategy: ship light, get feedback early, from people who actually farm. Even the prototype made its own tradeoffs visible — at one point the design answered “how many crop-and-market combinations exist” instead of the question that matters, “what should I plant”. Seeing that gap on screen was worth more than another month of debating it.
To make the early feedback count instead of relying on vibes, we instrumented the beta: PostHog with event tracking, the metrics that tell us whether the ranking is actually used, and an in-app feedback form. We're heading into a private beta with growers and agronomists — measuring, not guessing.
Where it stands
Both modules are at MVP. We're preparing the private beta for July 2026.
This is a live project, not a finished product — and writing it up this way is the point. No production metrics yet, because there's no production yet. What there is: a real problem, a design that's been pressure-tested, and a plan to learn from the first growers who touch it.